Goal tracker
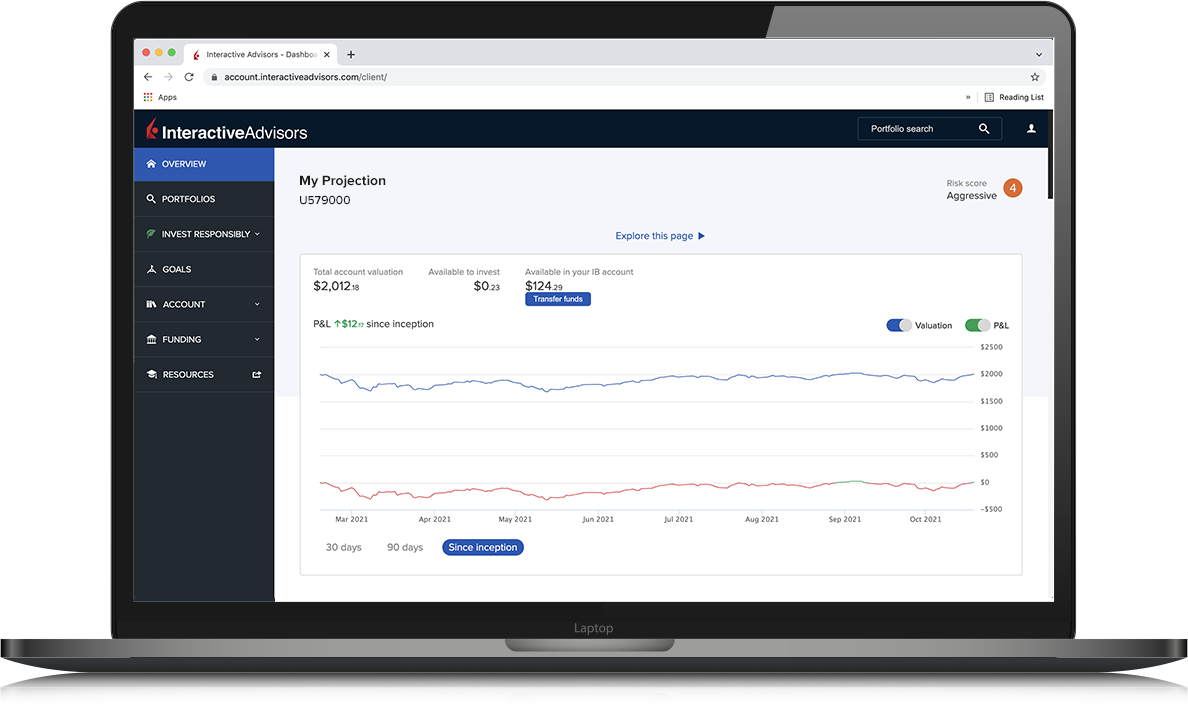
The goal tracker helps you manage your financial goals. It is built on our simulation engine that creates a unique projection based on your monthly contribution amount, goal target date and the cost or outflow associated with the goal.
We can't predict the future, but we can project it. The future is unpredictable. Our simulation engine runs many possible future scenarios to create a projection of your portfolio based on your contributions and risk profile. You can set and adjust goals at any time and our simulation engine will automatically create a new projection for you.

Why run simulations?
Markets are volatile and future portfolio value can vary significantly, which is why it is important to consider several different return paths that your portfolio can take. Some paths will result in performance that exceeds expectations, while other paths may result in performance that disappoints. Goal Tracker uses a commonly used statistical simulation technique called Monte Carlo, to simulate a range of paths for portfolio performance, based on long-term return estimates and annual volatility around those estimates.

Setting your financial goals
You can set a goal for any purpose by choosing a name, an amount, and how far it is in the future. The engine applies inflation to determine the amount on the target date. There are also more specialized goals which have calculations specific to college, a mortgage or retirement. This amount is compared with the median value of your account on that date to decide whether you are on target. The tool will tell you the likelihood of meeting your goals based on the current projection. A new projection is created each time you come back to check in on the goal tracker.
Using risk scores to track your goals
Interactive Advisors assigns every client and portfolio a risk score on a scale of one to five. Your personal risk score helps determine which investments are suitable to help you achieve your financial goals.

Personal risk score
We employ a questionnaire to determine your risk score based on your objectives, risk tolerance and financial capacity.

Portfolio risk score
We use quantitative as well as qualitative techniques to assign a risk score to each portfolio.
In order to estimate the likelihood of achieving your future goals, the goal tracker tool makes certain assumptions regarding the expected risk and expected return of your investments1. While actual realized performance of portfolios within the same risk score bucket may have a wide range of outcomes, the expected risk and return of portfolios within the same risk score bucket is assumed to be the same.
IA restricts clients from investing in portfolios that are deemed too risky for a client's risk profile.
How goal tracker works
Risk and return estimate across portfolio types
To compute expected risk and return estimates for each of the risk score buckets, we needed to look beyond the portfolios that are offered at IA. This is because most of the portfolios at IA have less than 5 years of performance history and their historical returns are thus not necessarily indicative of different market cycles1.
Instead we look at a wide array of liquid ETFs that have longer histories to come up with initial estimates of expected risk and returns. Indicative ETFs considered include:
| Risk score | Average of 15 year category ETF return | Average of 15 year category ETF volatility (risk) |
|---|---|---|
| 5.2% | 6.4% | |
| 8.3% | 14.7% | |
| 8.6% | 18.3% | |
| 9.3% | 20.4% | |
| 9.4% | 23.4% |
Expected Volatility
We do an additional calculation for expected volatility, which is consistent with our proprietary risk scoring methodology. Using the upper end of the volatility range, and using a 15-year estimate of SPDR S&P 500 ETF volatility of 13.7%. we arrive at a more conservative risk estimate.
| Risk score | Volatility range as % of S&P 500 volatility |
|---|---|
| 0 - 60% | |
| 60 - 110% | |
| 110-150% | |
| 150-200% | |
| 200% + |
Estimated risk
We use the numbers in green as return estimates, and the numbers in red as risk estimates for the different risk score portfolios at IA.
| Risk score | Average of 15 year category ETF return | Average of 15 year category ETF volatility/risk | Conservative estimate of volatility/risk |
|---|---|---|---|
| 5.2% | 6.4% | 8.2% | |
| 8.3% | 14.7% | 15.1% | |
| 8.6% | 18.3% | 20.5% | |
| 9.3% | 20.4% | 27.4% | |
| 9.4% | 23.4% | 34.2% |
Risk/Return estimates
For our Asset Allocation (AA) reference portfolios, we use the following risk return estimates.
| Return | Risk | |
|---|---|---|
| Reference: Conservative AA | 5.5% | 6.7% |
| Reference: Moderate AA | 6.6% | 9.3% |
| Reference: Aggressive AA | 7.8% | 13.4% |
How we arrived at these figures
chevron_rightManagement fees
These are the average management fees used for portfolios other than Asset Allocation portfolios by risk score.
| Risk score | Average management fee |
|---|---|
| 0.42% | |
| 0.28% | |
| 0.30% | |
| 0.58% | |
| - |
Account wide risk-return estimate
Since your investments may be distributed across multiple portfolios, we calculate risk return estimates for your overall account investments in real time.
The return estimate is simple to calculate. It is just a weighted average of the underlying return estimates across the underlying portfolio types.
The risk estimate is also just a weighted average of the underlying risk estimates across the underlying constituents, provided you assume no diversification benefits across the portfolio types. Since this represents a conservative approach in risk estimation, this is the approach we take.
| Return | Risk | |
|---|---|---|
| Reference: Conservative AA | 5.5% | 6.7% |
| Reference: Moderate AA | 6.6% | 9.3% |
| Reference: Aggressive AA | 7.8% | 13.4% |
| Cash | 0% | 0% |
| 4.5% | 8.2% | |
| 7.8% | 15.1% | |
| 8.2% | 20.5% | |
| 8.5% | 27.4% | |
| 8% | 34.2% |
Illustrative example
| Portfolio | Risk score | Amount invested | Proportion (%) |
|---|---|---|---|
| Cash | N/A | $5,000 | 10% |
| Reference: Aggressive AA | N/A | $20,000 | 40% |
| Clean Energy Portfolio | $12,500 | 25% | |
| Quality Portfolio | $7,500 | 15% | |
| Long Term Value | $ 5,000 | 10% |
Account wide calculation:
Estimated return = [0.1x0 + 0.4x7.8 + 0.25x8.2 +
0.15x8.2 +
0.1x8.5] = 7.25%
Estimated risk = [0.1x0 + 0.4x13.4 + 0.25x20.5 +
0.15x20.5
+ 0.1x27.4] = 16.32%
We also allow the client to explore additional ‘what-if’ scenarios. e.g,:
a) What if the available-to-invest cash were invested in your recommended portfolio:
Estimated return = [0.1x7.8 + 0.4x7.8 + 0.25x8.2 +
0.15x8.2 + 0.1x8.5] = 8.03%
Estimated risk = [0.1x13.4 + 0.4x13.4 + 0.25x20.5 +
0.15x20.5 + 0.1x27.4] = 17.66%
Estimated return = 7.8%
Estimated risk = 13.4%
Caveats and disclosures
The long-term return estimates used by the Goal Tracker tool are estimates intended to provide a general guideline for the potential returns of a client’s investment with Interactive Advisors. The projections or other information generated by the long-term return estimates regarding the likelihood of various investment outcomes are hypothetical in nature, do not reflect actual investment results or the realized returns of any of our portfolios, and are not guarantees of future results. Hypothetical projected portfolio returns assume reinvestment of interest and dividends and do not include taxes or inflation adjustments. Hypothetical projected portfolio values could differ significantly from the actual performance of any of our portfolios. As such your likelihood of achieving your goals portrayed by the tool may be overstated and unrealistic.
Goal tracker allows the user to set varied goals - e.g. vacation expense, medical expense, house down payment, college expense, retirement spending etc. Most of these goals require the user to just indicate a goal amount and a goal target date. For many of these goals, the goal tracker assumes a lump sum outflow on the target date. Exceptions are the college goal and retirement goal. The college expense goal assumes 4 annual payments, rather than a single payment. The retirement goal assumes monthly outflows for expenses, as well as monthly inflows for social security checks5. For IRA accounts we assume no Social Security inflows and compute an approximate mandated Required Minimum Distribution6 based on no penalty retirement age and a linear schedule7. All future inflows and outflows are adjusted for inflation. We assume an inflation rate of 3% which is consistent with the average observed inflation rate over the last 20, 40, 60, 80 and 100 years during which period inflation has fluctuated between 2 and 4%8. All outflows are after-tax and assume a long-term capital gains tax of 20%. While capital gains can be taxed at 0%, 15% or 20% depending on income, we take a conservative approach and assume that the client is paying the highest rate. IRA distributions in retirement are assumed to be taxed at 25% based on a conservative estimate applicable to most clients9.
The tool’s estimates and projections are hypothetical in nature, do not reflect actual investment results for your account, the account of any other Interactive Advisors client, or the realized returns of any of the portfolios, and are not guarantees of future results. There is no guarantee that you will reach your goal(s), and assumptions not used in this tool and other market developments can affect the probability of reaching your goal(s). Interactive Advisors does not make any representation that any client will or is likely to achieve results similar to these by investing in an Asset Allocation or another portfolio on its platform. The tool’s estimates and projections can vary with each use and over time. These estimates and projections are provided for informational, educational and illustrative purposes and are not intended to constitute and should not be relied on as a full financial plan, comprehensive financial planning, legal or tax advice. Interactive Advisors does not in any way represent that the estimates generated using this tool are based on or meant to replace a comprehensive evaluation of a client’s entire personal portfolio. None of the tool’s projections should be construed as an offer, recommendation or solicitation to buy or sell any security. Past performance is no guarantee of future results, and all investments, including those in any portfolios, involve the risk of loss, including loss of principal (the money you invest) and a reduction in earnings. Returns shows are net of fees and expenses. Please review the assumptions section for the fee level used to model the returns. Returns reflect the reinvestment of dividends.
- 1 https://www.sdattonline.org/single-post/2018/10/12/The-Risk-and-Return-Relationship
- 2 Shares Core Aggressive Allocation ETF , iShares Core Growth Allocation ETF , iShares Core Conservative Allocation ETF
- 3 See estimates provided by Vanguard and Norges Bank
- 4 See cost calculator provided by Interactive Advisors. The 0.20% commissions and management fee level is the highest percentage level that could be charged for an investment in one of our Asset Allocation portfolios and corresponds to the lowest investment amount in one of these portfolios (i.e. $100).
- 5 Social security inflows are calculated based on tables and formula .
- 6 See IRA Required Minimum Distributions
- 7 See See IRA RMD worksheet
- 8 See inflation calculator
- 9 See Tax Brackets for IRA distributions